Google launches Chrome DevTools for Mobile, lets developers debug Web apps via emulation and screencasting
Google today announced an update to Chrome 32 beta for Windows, Mac, Linux, and Android that adds a slick new feature: Chrome DevTools for Mobile. In short, the new addition lets developers to develop and debug mobile Web apps through an improved viewport emulation and zero-configuration, screencast-enabled remote debugging.
While designing your app, DevTools lets you go through the popular device screens without leaving the development environment. Here’s how it works.
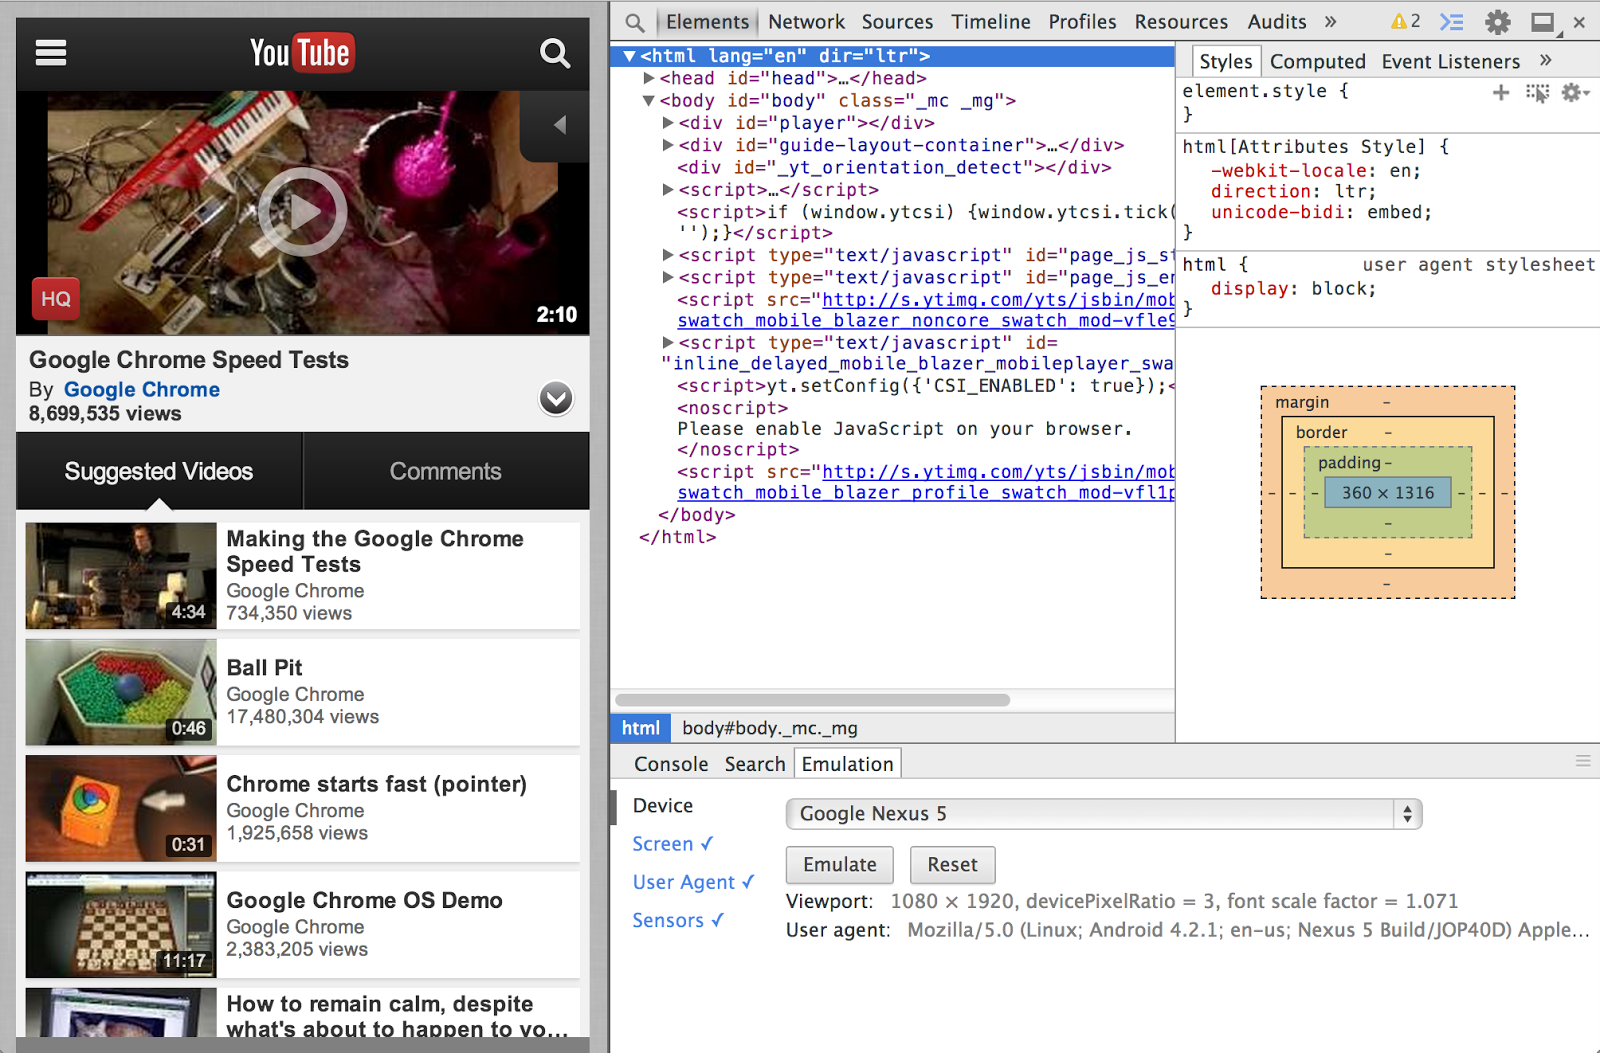
All you have to do is select a device from the Console drawer’s Emulation tab (check “Show ‘Emulation’ view in console drawer” in DevTools Settings), and all the relevant viewport properties will be set for you. DevTools will run the page through the same mobile viewporting code used in mobile Chrome, and will also give you control of the emulation parameters, such as screen resolution, touch emulation, devicePixelRatio, user agent, sensors, and so on.
If you need to test the actual web app’s performance on a real device, you can do that with the newly added support for native USB discovery of connected devices. Head to Tools and choose Inspect Devices, or visit the about:inspect page.
The best part is that no configuration is necessary, there’s no need for the adb command line tool, and you don’t need extensions to see all instances of Chrome and WebView on connected devices. While connected over USB, you can just screencast the full viewport content from the device to DevTools.
More to follow.


